
Table of Contents
- City index studies combine SEO, digital PR, and brand awareness by leveraging data-driven or emotionally engaging content.
- These listicles often earn authoritative backlinks through “ego bait” and regional pride, boosting Domain Authority and visibility.
- Success hinges on smart ideation, credible data sourcing, and transparent methodologies tailored to specific ranking criteria.
- Visual elements like maps and infographics enhance shareability and journalist pickup; personalization in pitching maximizes coverage.
- Tie studies to keywords with search volume for added exposure and traffic.
“Top Cities for Hiking,” “Best States to Start a Business In,” “Most Exciting Summer 2024 Road Trips,” and “Worst Places to Own Income Property.”
We’ve all seen regional articles highlighting the best and worst reasons to be present in different cities, states, countries, etc.
These types of posts have many names. They may be referred to as “indexes,” “regional studies,” “city studies,” or “city listicles.”
For this post, we’ll call them “city studies.”
Like any reputable content, they inform a target audience. But, city studies have other higher-level goals, from SEO to brand awareness.
A sound strategy from ideation to research to analyzing results is critical to achieving these goals.
So, let’s break down the goals of city listicles and the entire strategic process that will help you succeed.
Why These Work for Digital PR
City studies have proven to be a tried-and-true digital PR strategy because they make great news stories.
They provide ego bait that elicits emotional responses and are (usually) backed by data.
Ego bait
Ranking high on a city study makes a city look good. It’s something to brag about. I’ve seen city studies get talked about in TV spots, magazines, municipal websites, and even Mayoral speeches!
Emotional tie-in
Some studies suggest the opposite response. Instead of feeling good about your city, you might feel outraged- making for a good news story.
For example, learning that your city is the worst city for bed bug infestation, or TomTom’s cities with the Worst Traffic.

Goals of City Study Articles
There can be many reasons a content creator decides to do a city study article.
Still, this type of content’s three big goals are to increase DA, expand brand awareness, and improve SEO rankings.
Gain Backlinks
City studies are an excellent tool for obtaining relevant and authoritative backlinks.
Gaining quality links is the best way to increase a site’s Domain Authority or Domain Rating, making it easier to rank (as you’ll see next).
SEO Rankings
Digital PR and SEO work well together.
Backlinks achieved through city studies not only help raise overall site authority, but through strategic targeting and internal linking, you can also help boost ranking to your site’s priority pages.
For instance, if you want to rank for certain keywords in a specific region, such as “Memphis art galleries,” you could create and pitch a city study around the “Best Art Galleries in Tennessee” and include internal links to your Memphis art galleries page.
Brand Awareness
Lastly, if every local publication doesn’t include a link, the awareness and exposure you gain through the brand mentions can still send quality branded traffic to your website.
1. Ideating Your City Study
Creating a city listicle article has five main parts: ideation, research, targeting, pitching, and tracking. Let’s start with ideation.
Before we discuss how to ideate your study, it’s important to note that you always want your data to produce surprising results; the more obvious the results, the harder it is to pitch.
For example, if you are writing about the cities with the best weather and San Diego wins, that is relatively obvious and most likely won’t get much coverage.
So, keep that in mind as we go through the steps.
Identify the Topic With Predetermined Target Cities
If you know a list of cities you want to include, you can look for ways they relate or overlap and identify a topic.
For example, you might want to rank for keywords in a specific region, such as “art galleries” in Memphis and Los Angeles.
You’d want to start researching similarities in the art industry in Memphis and Los Angeles. Maybe they both have similar styles of art or artist co-ops.
Maybe both cities have prominent art schools?
Then you could create an article about the best cities for artists; of course, you can include “art galleries” for your targeted keywords.
Identify the Topic with No Set Cities in Mind
You might be in the situation where you see the benefit of doing a city study, but don’t have specific cities in mind to start.
Maybe your audience stretches a wide geographic region covering hundreds of cities. Maybe you are a fully digital brand and location doesn’t matter.
In either case, let search engines like Google help. Start by typing in terms like “best cities for,” or “top cities for,” or “cities with the most.” You get the point.
Take a look at the autofill that Google is populating when you start typing these terms and this will give you multiple ideas of what people are searching.
From there, you can create a list of your favorite options and analyze their search volumes to narrow down your focus.
Identify the Topic Based on a Keyword
Another approach is to find a keyword relevant to your site that you can realistically rank for and create a city study targeting that keyword.
For example, “best cities for artists” has a search volume of 200, and there is good potential to rank for keywords in this topic, as seen by the KD(keyword difficulty) of 5.
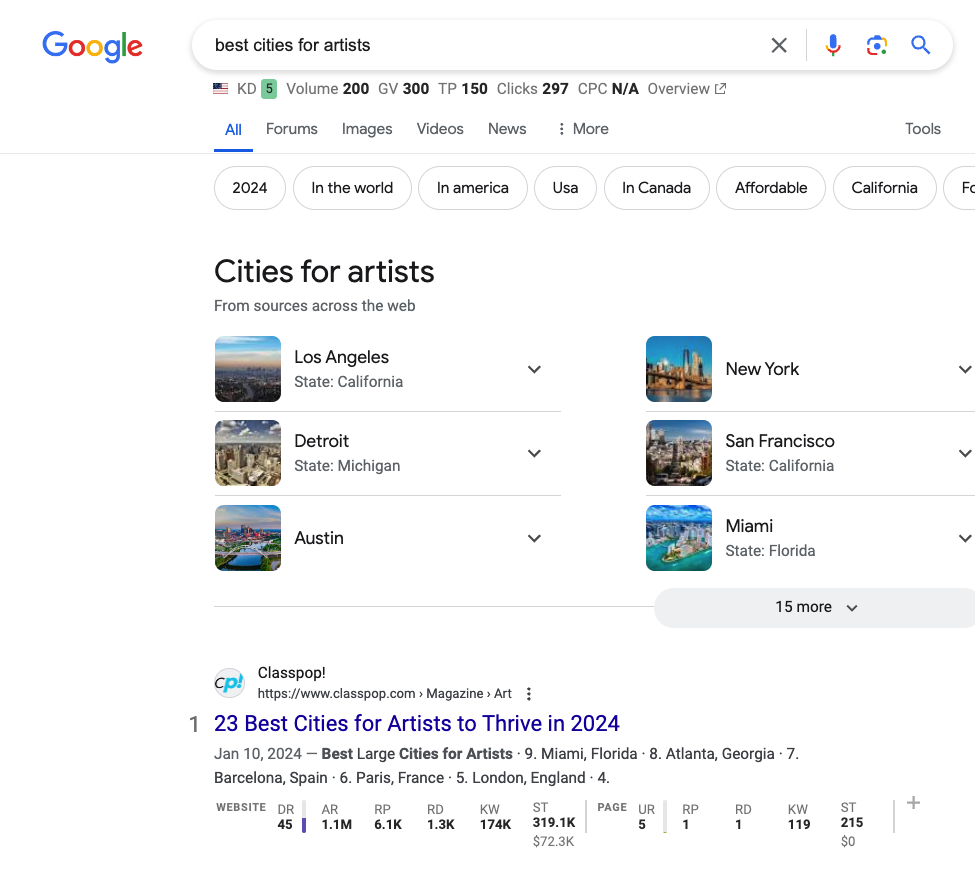
Going by the highest search volume doesn’t always get you the golden goose. You also want to compare the difficulty of ranking for those keywords.
2. Determine the List Type
Once you have your idea, you might already have a few cities or regions that should be included in your list, but you will need to fill in the gaps with several other contenders.
There are four main list types to do this:
- List based on proprietary data
- List based on customer survey data
- List based on third-party data sources
- List based on Non-data-backed insights
For instance, if we knew Memphis and Tennessee needed to be on our list, we’d want to find other cities to include.
Using Proprietary Data or Third-Party Survey Data
Proprietary data will always be valuable to entice reporters to write a story about your article.
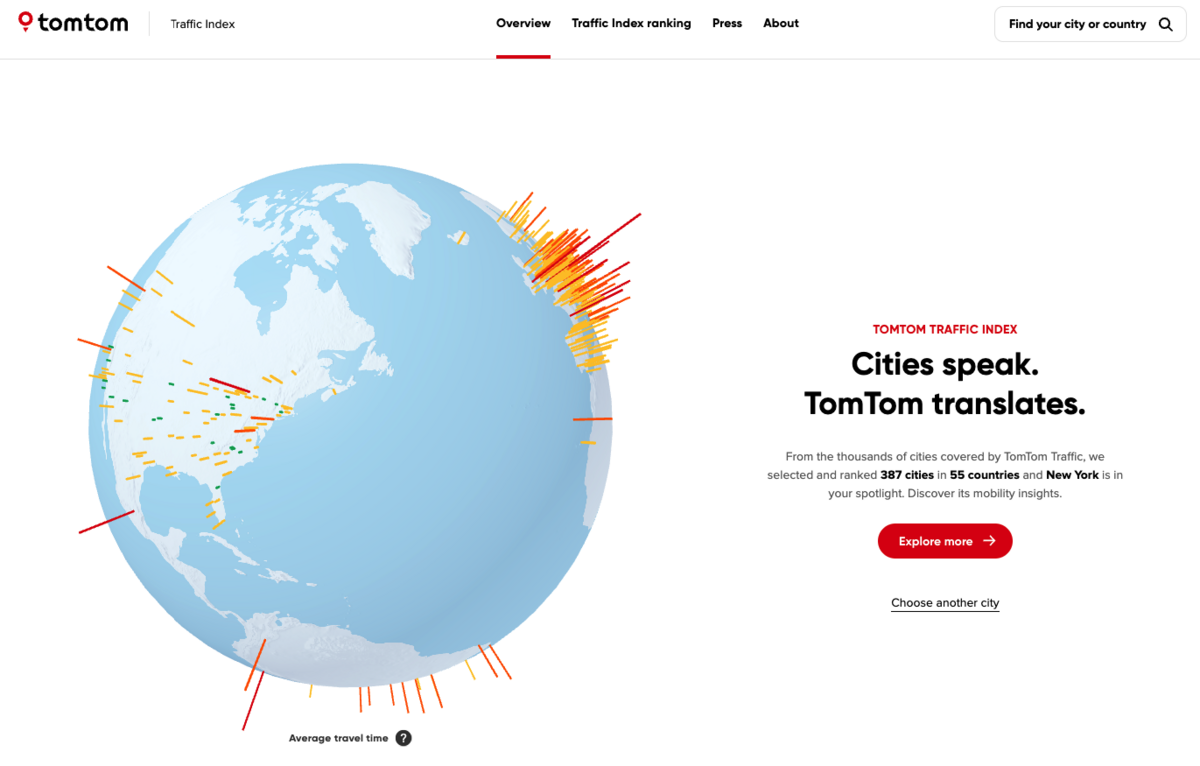
For instance, the aforementioned TomTom traffic index is based on data from over 600 million TomTom in-car navigation systems and smartphones.
Proprietary data can be hard to come by, so sometimes, you can work with your audience instead.
Survey Your Customers
You can survey your customers, depending on the size of your customer database (and their willingness to participate).
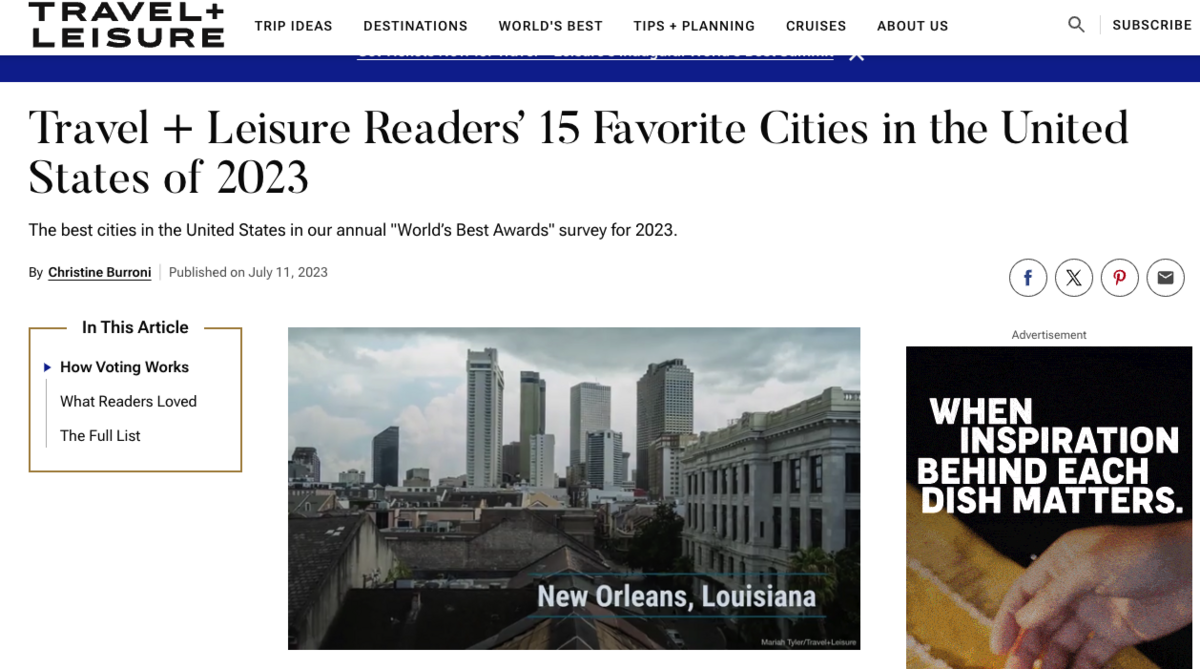
For instance, each year, Travel & Leisure surveys its readers (over 160K) to develop its “Best Cities in the United States” list.
Alternatively, you can use a third-party survey service to reach a bigger audience.
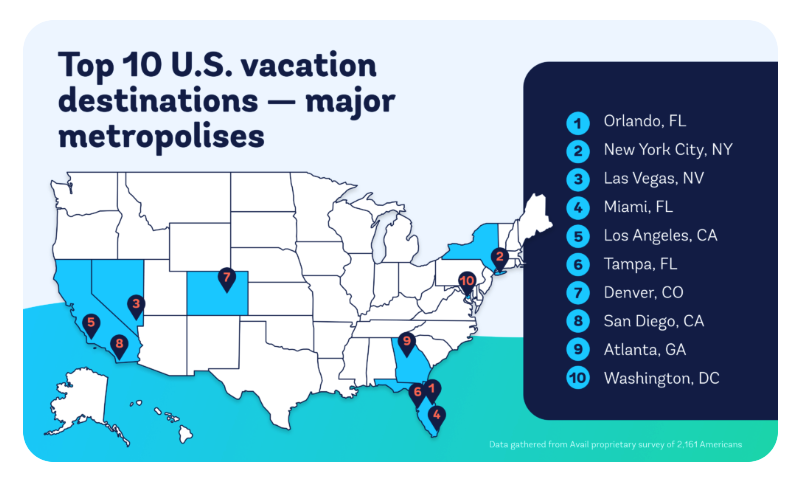
For example, for Avail’s Top Vacation Destinations, they surveyed 2,000+ Americans for their data.
Survey platforms like SurveyMonkey, Pollfish, OnePoll, YouGov, all provide survey results at various prices.
For a standard audience survey of ~2,000 respondents, expect to spend around $2,000-$5,000 depending on the platform.
Using Data from Third-Party Data Sources
There will be costs involved in conducting these surveys, so if this is outside your budget, you can always rely on good old-fashioned research to gather various sources of information.
If choosing this route, select reputable sources and cite them properly in your article.
Some examples of reputable sources for various data points are the World Health Organization, the U.S. Travel Association, the World Bank, the United States Census Bureau, and others.
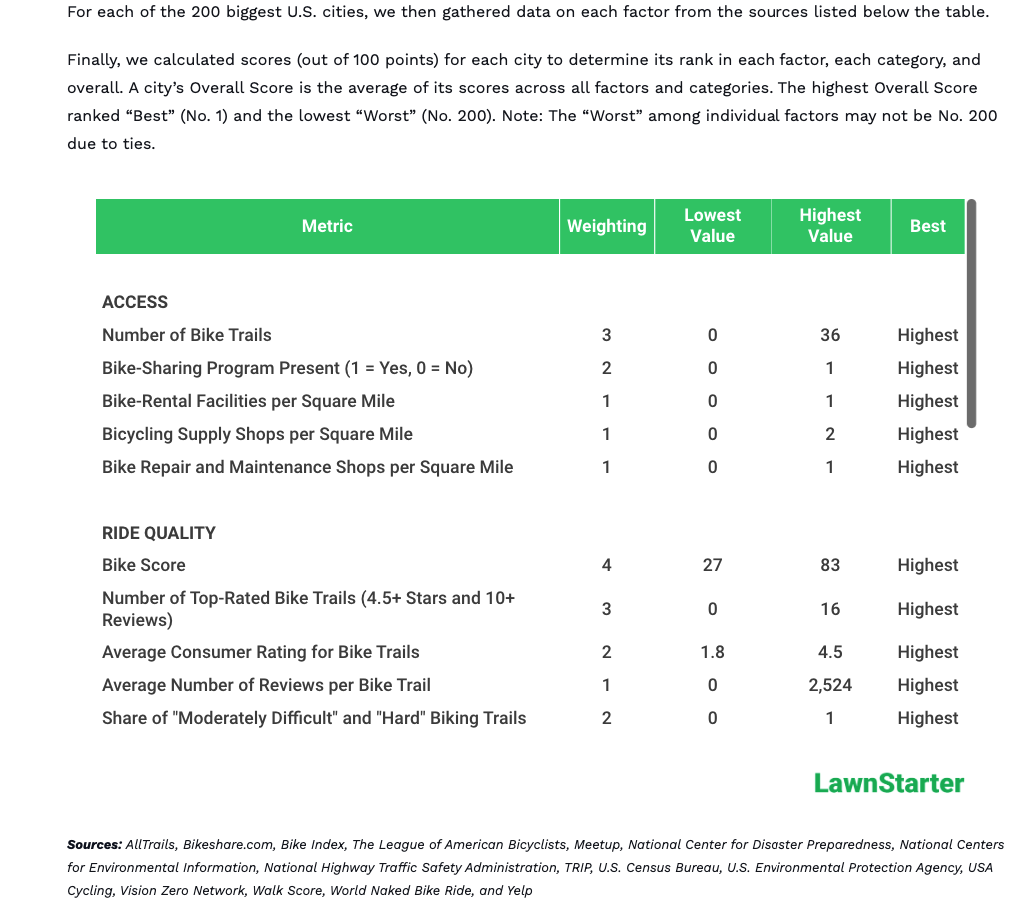
For example, in Lawnstarter’s Best Cities for Biking post, their methodology shows that they gathered data points from 16 data sets, including the National Center for Disaster Preparedness, National Centers for Environmental Information, National Highway Traffic Safety Administration, U.S. Environmental Protection Agency, Yelp and more.
Many city studies go the third-party route due to the lower costs. I’ll walk you through exactly how in step 3.
Using Non-Data-Backed Insights
Some larger sites can get away with utilizing less data-backed studies and rely solely on their brand’s reputation.
For example, although Thrillist’s “Best US Cities for Creatives (That You Can Afford to Live In)” provides some data to back up how cheap it is to live in the city, there is no outright methodology.
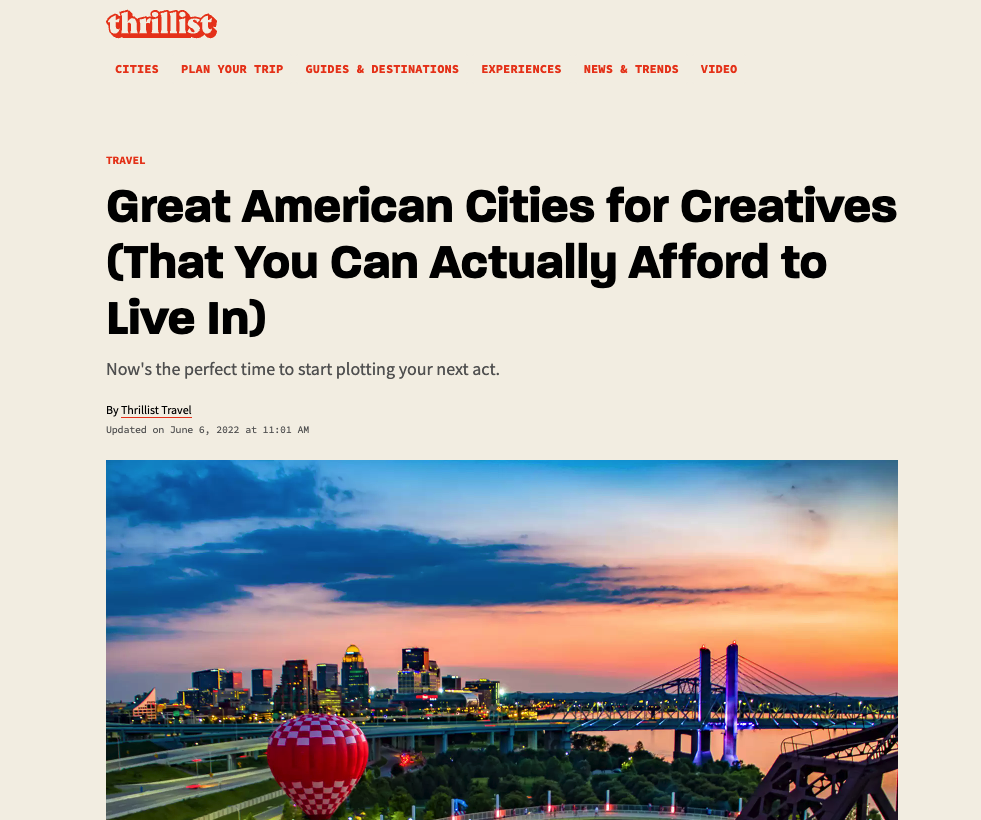
You can tailor lists like these to meet partnership or traffic goals because you can add cities without adhering to a strict ranking system.
Or, your site may be authoritative enough in a specific industry or niche that you don’t need to provide as much data.
For example, publisher Backstage.com ranks for “the best cities for actors” with a standard non-data-backed list.
The potential downside of these is that you can easily get outranked if someone does come along with a data-backed study.
3. Creating the Post
You can then write your post based on how you get your data.
Since ranking studies based on third-party data sources are most commonly used, let’s run through how to do it yourself.
Let’s say you wanted to do the best cities for artists and needed to create your city list from scratch.
The process involves establishing criteria, gathering data, weighing the data, analyzing it, and writing the post.
Establish Your Ranking Criteria
First, we must develop criteria that tell us a city is great for artists. Things like:
- Number of galleries and museums per capita
- Number of art schools and programs
- Number of art festivals
- Number of theaters and music venues
- Number of local, national, and international art awards
- Number of local media outlets covering the arts
- Number of art classes or workshops
Brainstorm with your colleagues. Look at social media. Try a Google Search.
For example, I found this list of art-related businesses, which I had omitted from my list. That may be a criteria to include.
Find Data Sources and Gather Data
Before weighing your criteria, it’s a good idea to ensure you can find the data sources you need.
This is one of the process’s potentially tricky parts.
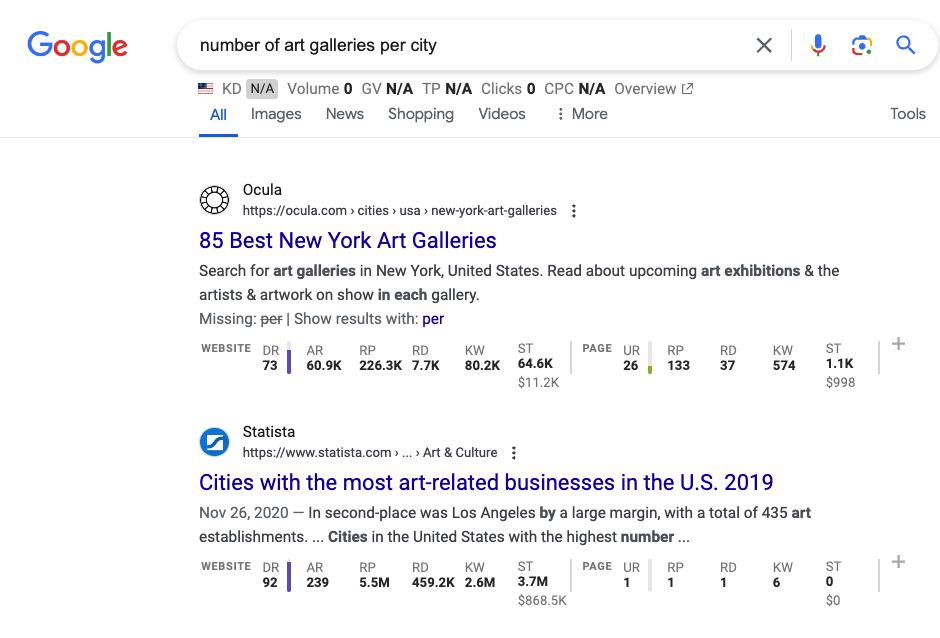
To find data sources, Google search for the data you are looking for. You may get lucky, and there is a dataset that compiles everything.
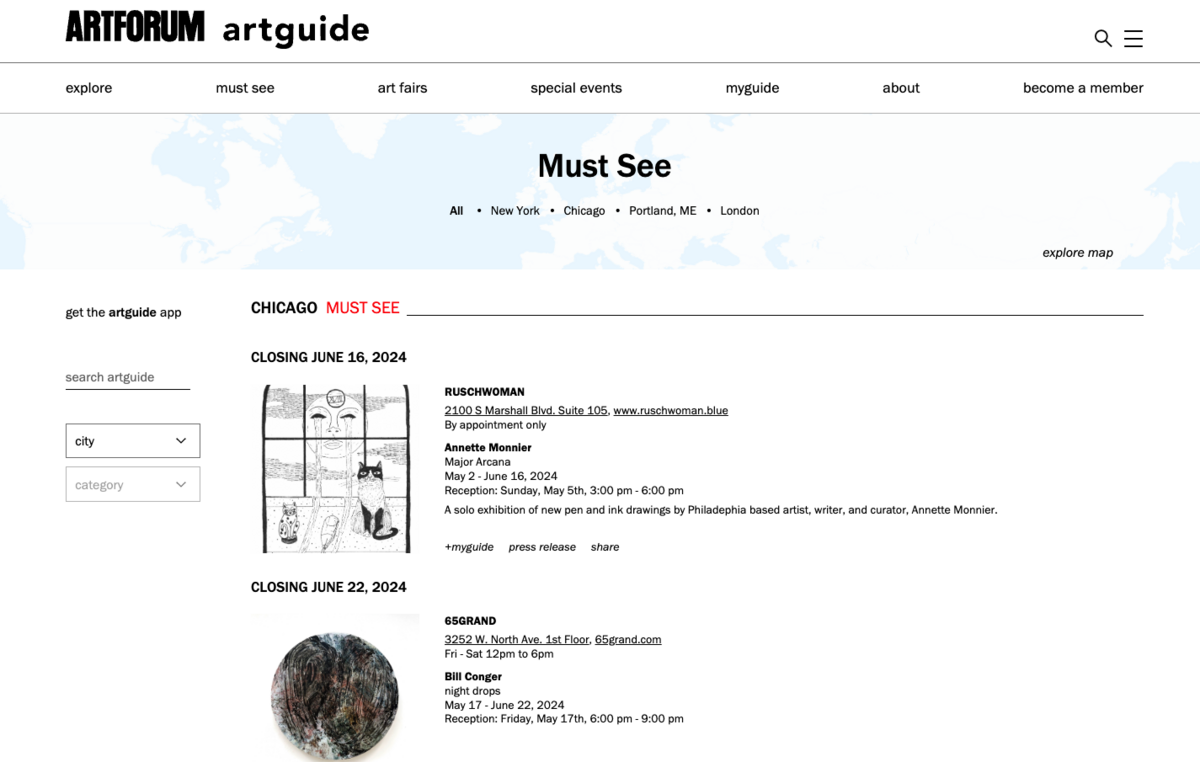
For instance, if I search for art galleries worldwide, I’ve found a site called Artforum, which provides a comprehensive directory of art galleries worldwide.
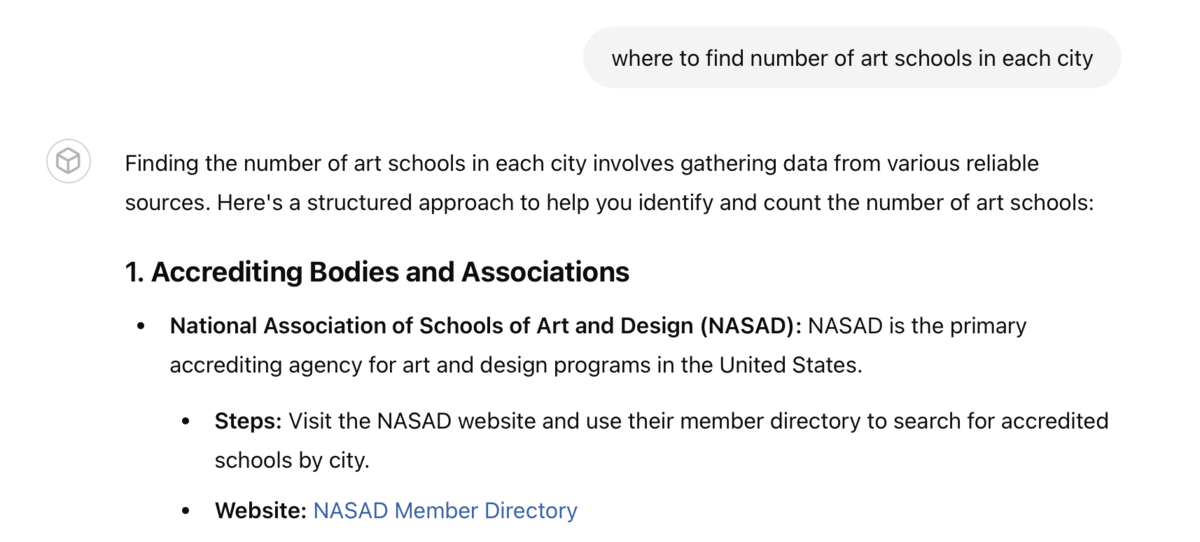
ChatGPT helps identify data sources based on your needs.
For instance, when I asked where to find the number of art schools in each city, it pointed me to the National Association of Schools of Art and Design (NASAD).
Collecting the Data
Collecting the data itself can be tricky. If you can’t download a CSV file from the website, you can manually compile it.
For instance, NASAD has a list of accredited institutions. So, if I wanted to start gathering data for each state, I would start with Alabama then add them to a spreadsheet.

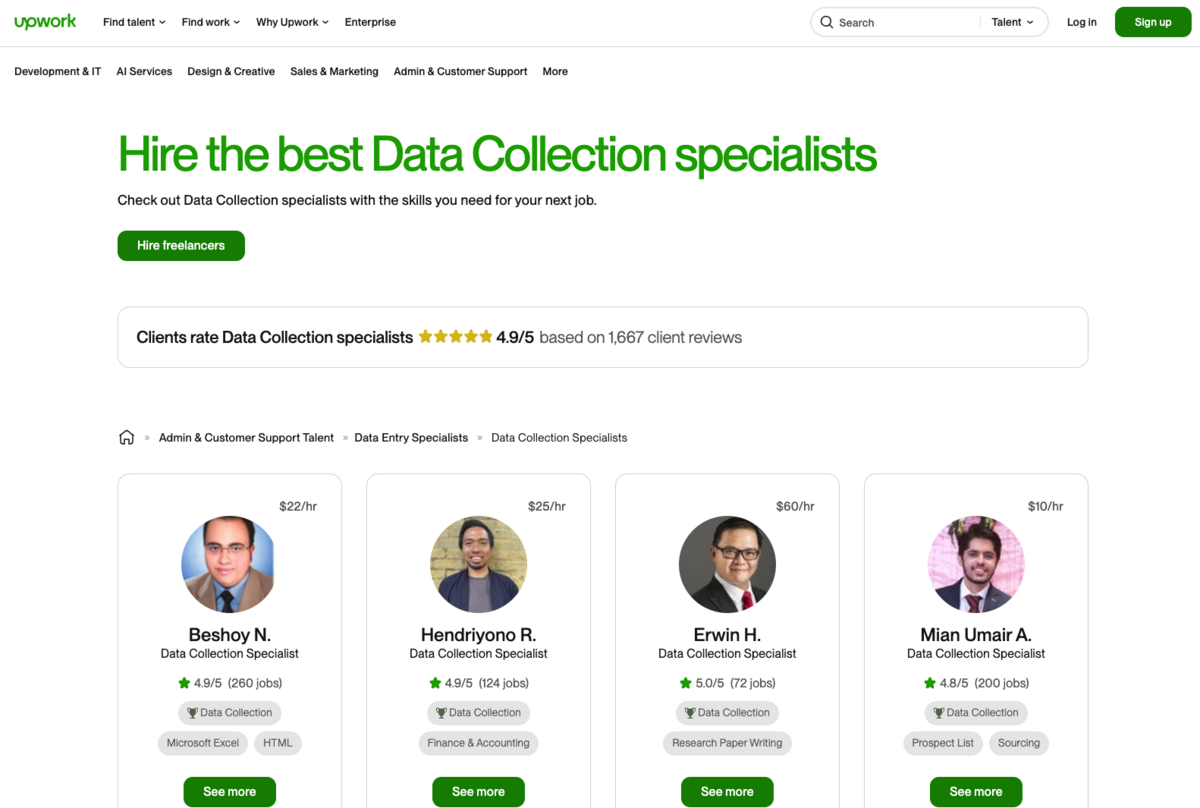
Some hire freelancers from sites like Upwork, but you must ensure they pull the data correctly.
For instance, Upwork has an entire section of data collection specialists.
Alternatively, you could contact the website to let them know who you are and what you are doing, and they will typically help you — especially if you tell them you will feature their site on your post (everyone’s up for a free link!)
Something like:
Hi [NAME],
I am working on a research project with [Website Name], and we’d love to get some custom data from you.
We are specifically looking for [Data].
Our timeline for this project is [Timeline].
Of course, we will feature a link in the post to [Source] once it goes live.
Thanks!
By the end of compiling, you might end up with a list that looks something like this (Note this is made-up data.):
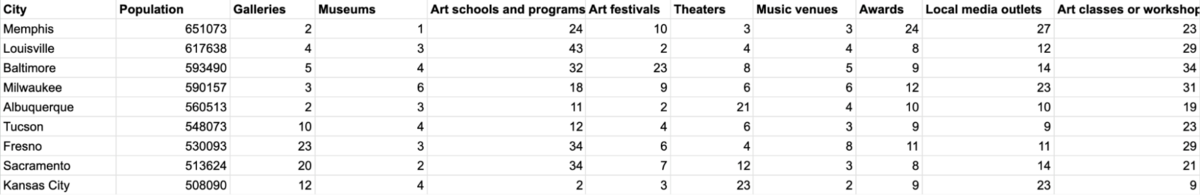
Once you’ve gathered your data, you need to figure out what and how to weigh each criterion.
Weigh Your Criteria
Ultimately, you want to come away with a total score to rank everything.
For instance, in the LawnStarters above “best cities for bikers” study, you can see their weighting calculation at the bottom.
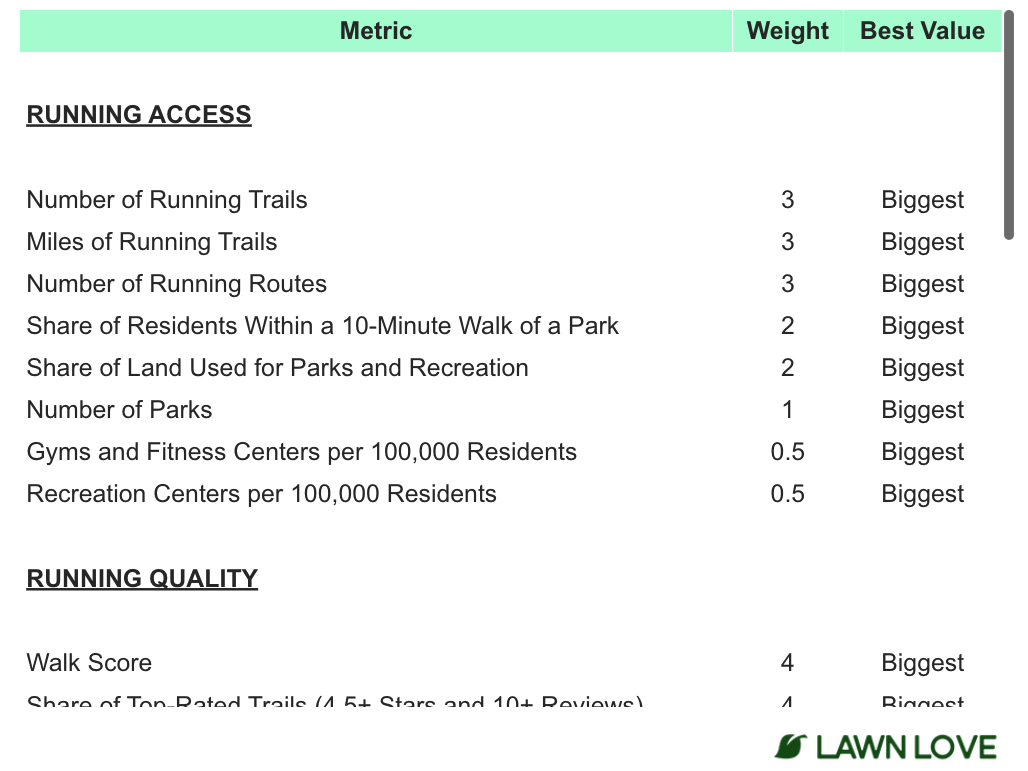
The “weight” is essentially a multiplier. So, if they found 3 running trails, the total score would be 9.
For our artist’s post, let’s group our criteria similar to Lawn Love’s. We’ll group and assign a weight out of 100.
Now, these can be done in hundreds of different ways based on your preferences as a content creator, but for our post purposes, let’s prioritize exhibiting and selling work, followed by cultural vibrancy and events.
Then, education, publicity, and continuous learning with art classes and workshops.
Our breakdown might look something like this:
Focus on Exhibiting and Selling Work: The emphasis on galleries and museums (35 points combined).
- Number of galleries (20)
- Number of museums (15)
Education and Skill Development: Art schools and programs (15 points).
Cultural Vibrancy and Events: (30 points combined).
- Number of art festivals (10)
- Number of theaters (10)
- Number of music venues (10)
Recognition and Publicity: Awards and media coverage (15 points combined).
- Number of local, national, and international art awards (10)
- Number of local media outlets covering the arts (5)
Continuous Learning: Art classes and workshops (5 points).
With the weighting set, there’s only one more thing to do: calculate the scores.
Calculate Your Score
Getting back to our spreadsheet, we can add weighting to each based on a percentage of 100. So our calculation might look like this:

So, a snapshot of the total scores based on our fictional data would look like this:
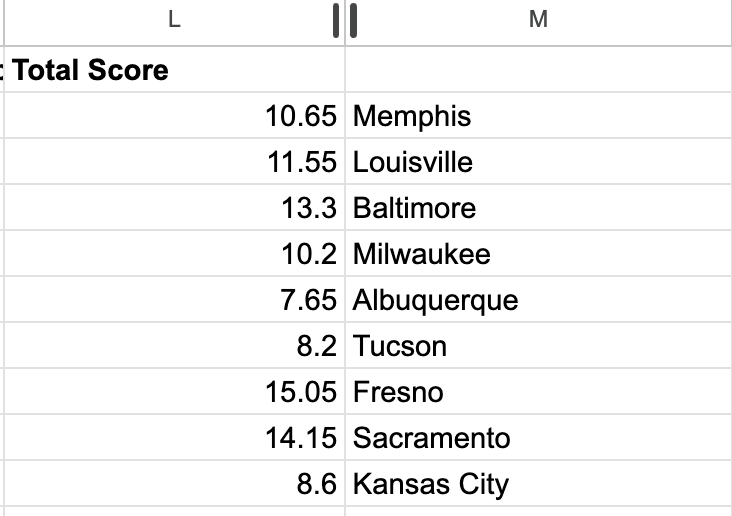
Memphis is the best city for artists, followed by Louisville and then Baltimore.
4. Crafting Your Post
Now that you know the winners, you can begin to write your post.
Some sites might not write a post that gets hosted on a site and instead prefer to publish and distribute via press release only. Others do both the post and the press release.
For our purposes, let’s assume we have a post. As you’ll see in the examples section at the end, most posts follow a similar layout.
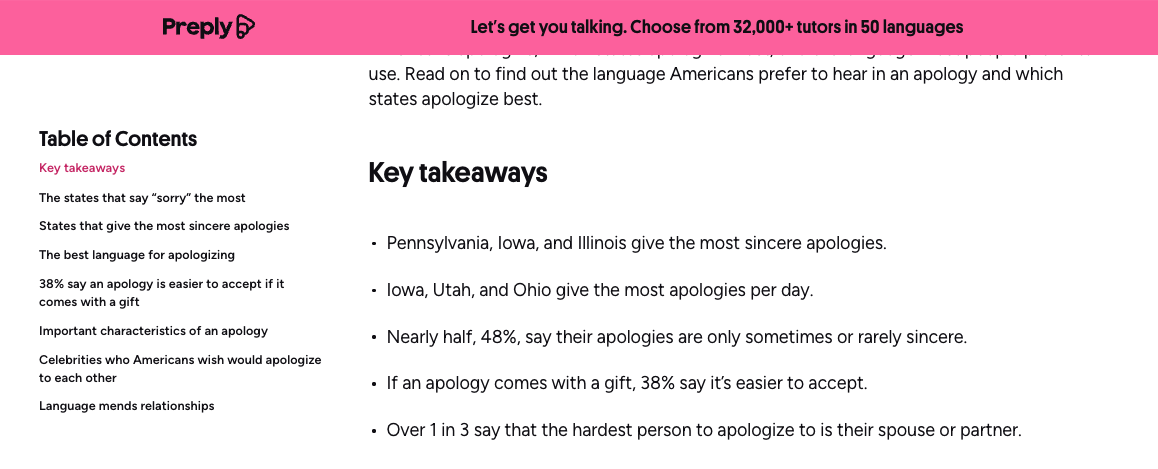
Takeaways Section
This highlights the most important takeaways for the reader. For example, Preply’s takeaways from their States That Apologize The Most are here.
Methodology
This section explains exactly how you came up with your ranking.
For example, here is WalletHub’s methodology for the Best Cities for Singles:
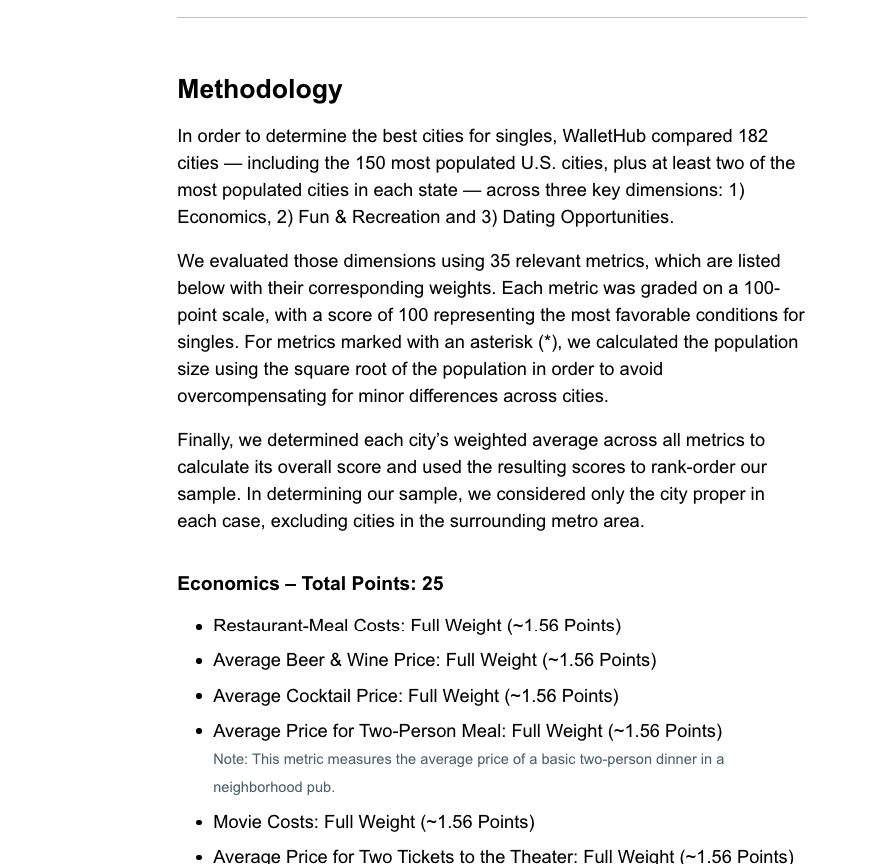
They talked about where they got the data and how they scored, and they weighted everything.
I recommend putting the methodology at the beginning of the study, as it gives journalists and readers more context.
However, you’ll sometimes see these at the end of a post, especially with bigger brands that have conducted many data studies.
For example, the WalletHub study above is listed at the end of the post.
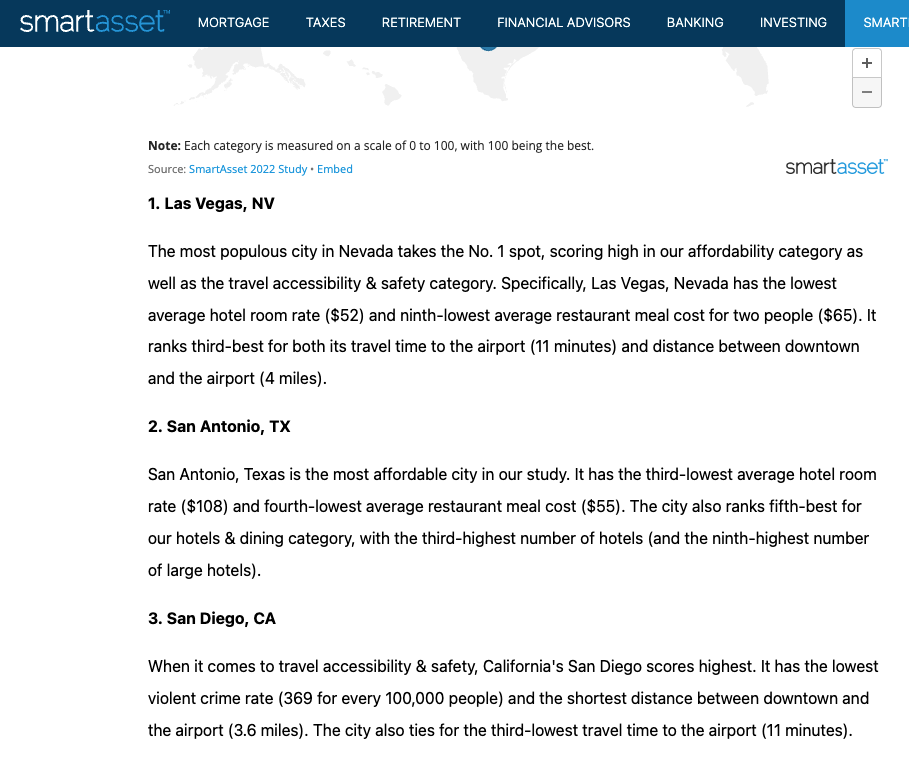
List the Top 10 (with Photos)
The most critical piece of your post is the list of winning cities.
Most city studies list at least the top five to ten cities. (Sometimes sites list the bottom-ranking cities as well, if applicable.)
When displaying, provide a little information about why each city ranked where it did to help give some context.
For instance, SmartAsset’s Best Cities for Conferences briefly explains why each city ranks where it does, referencing the specific criteria.
But brands choose many different layouts for these.
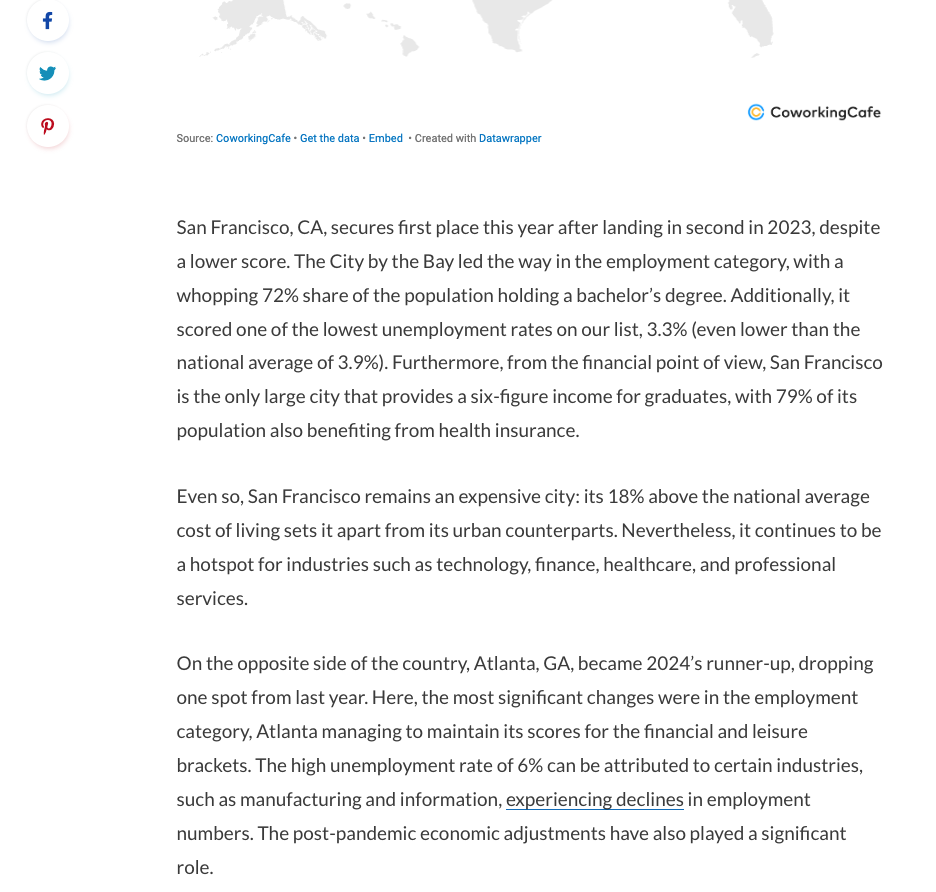
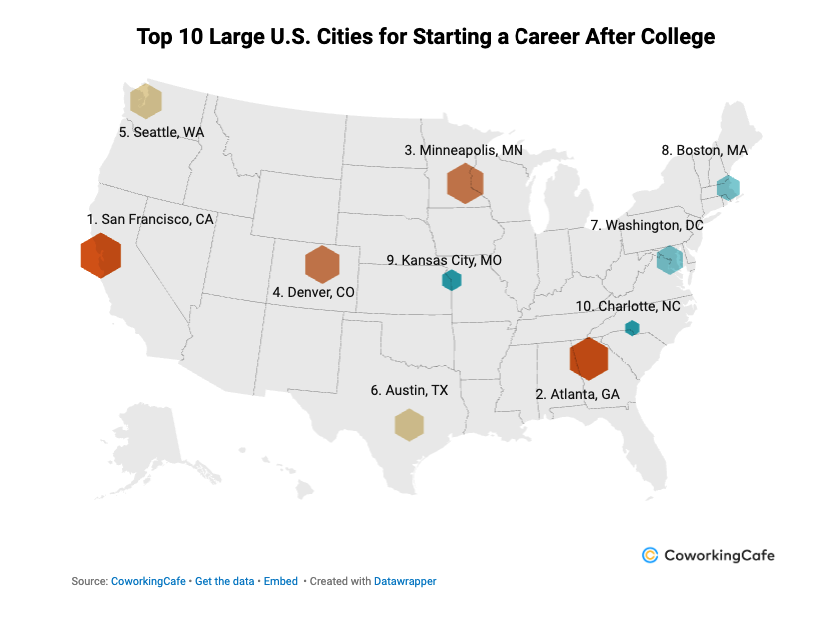
Instead of highlighting each top city in detail, their Best Cities for Class ‘24 CoworkingCafe provided a more general analysis that groups regions and ties to their main takeaways.
Full Data List
Not every post provides the entire dataset, but it can be beneficial for users and for pitching to journalists.
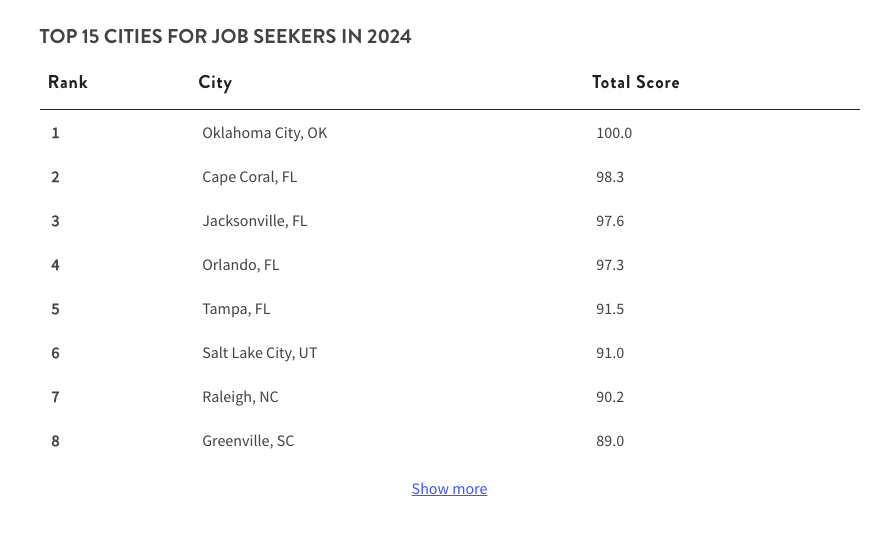
These can be static lists, like the one found on MoneyGeek’s Top Cities for Job Seekers:
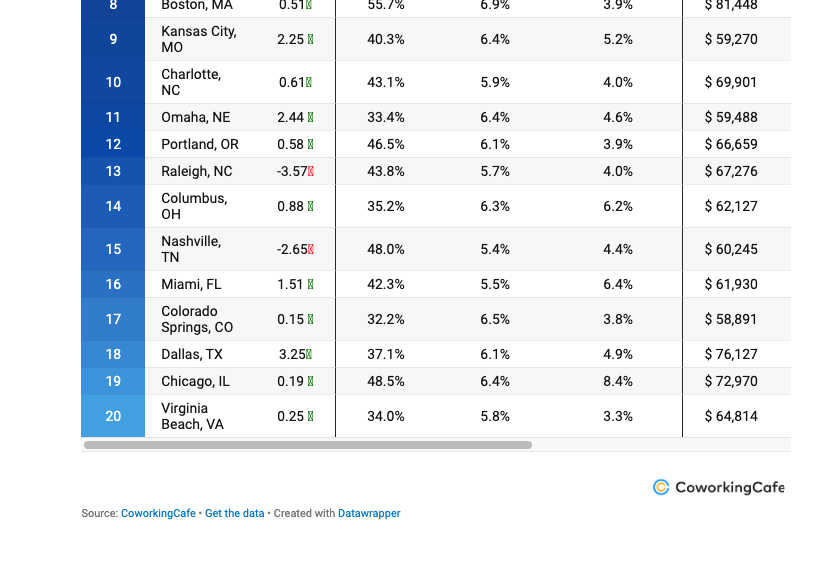
Or can use a data visualization tool like Infogram or DataWrapper for an interactive table like CoworkingCafe’s:
Expert Commentary
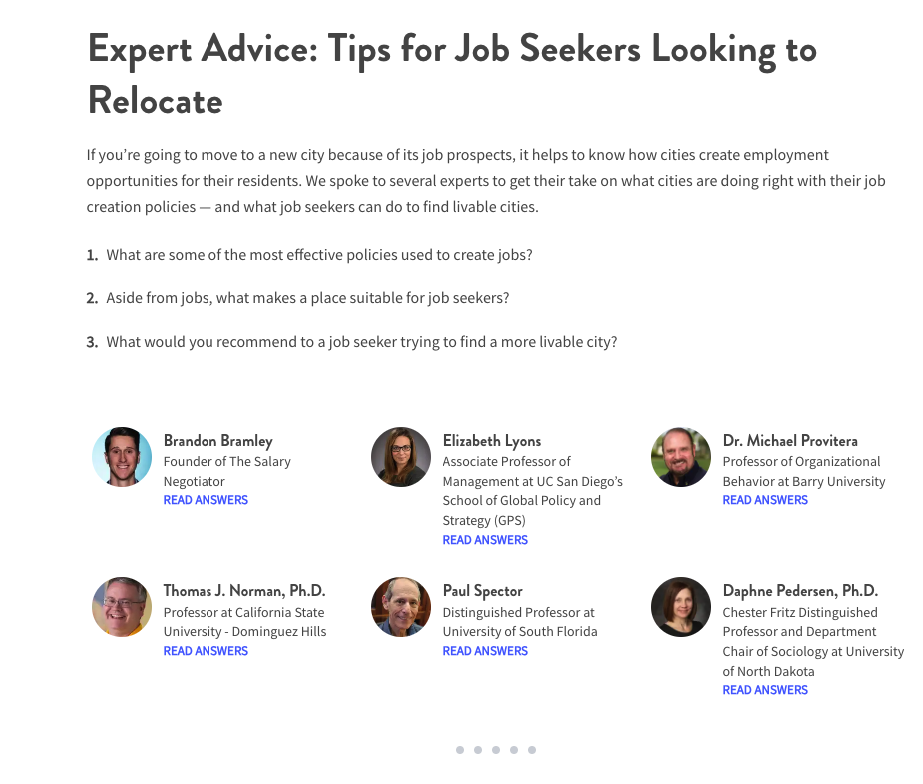
Another common feature of city studies is expert commentary. As you can see in MoneyGeek’s Top Cities for US Job Seekers, they’ve rounded up expert advice from authorities in the space.
Do you need this?
No, but it can help support your claims and display more credibility, especially if your site is newer or your topic is outside your brand’s wheelhouse.
Design Shareables
I strongly recommend creating shareable maps for your city study. These can be static graphics or interactive elements.
So, in our case, we’d want to display a map with the top-ranking cities.
Maps
Again, tools like Datawrapper or Infogram have mapping capabilities.
The benefit of an interactive, embeddable map is that journalists will often take the embeddable asset and put it directly into their posts.
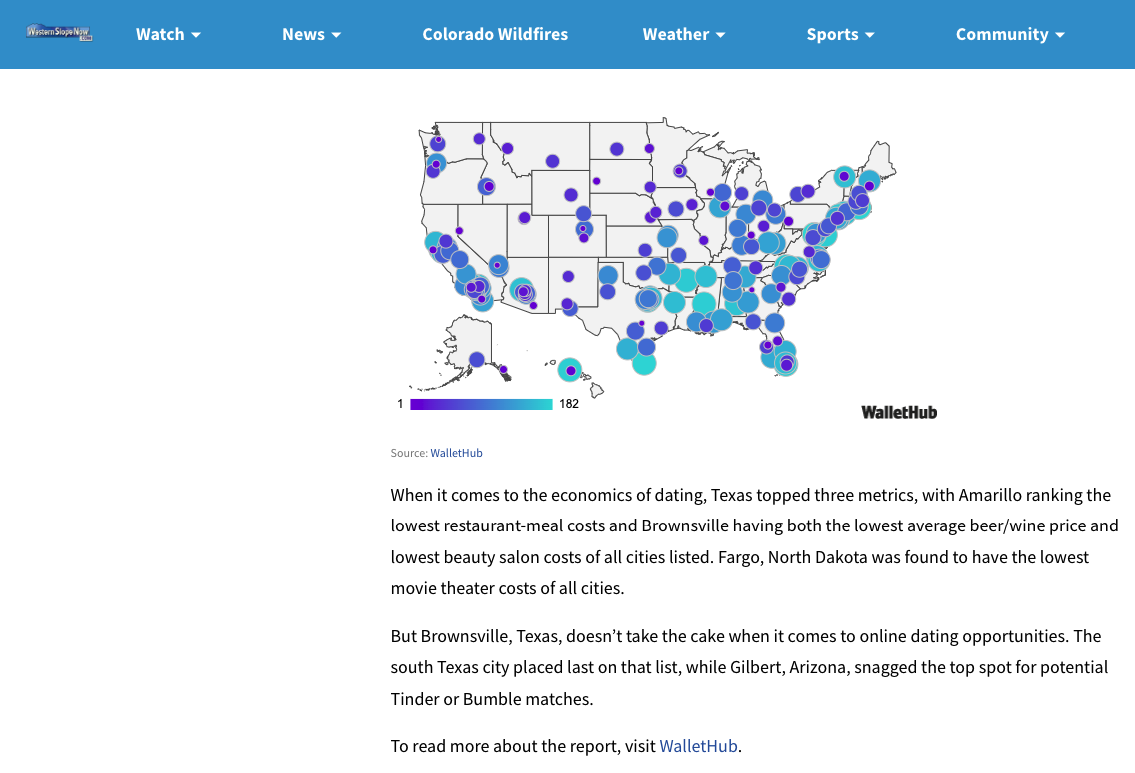
For example, the Colorado News site Western Slope Now actually displays the embeddable chart from WalletHub directly into their story here:
Some shareable assets include a map and a list, like Avail’s Top Travel Destinations:
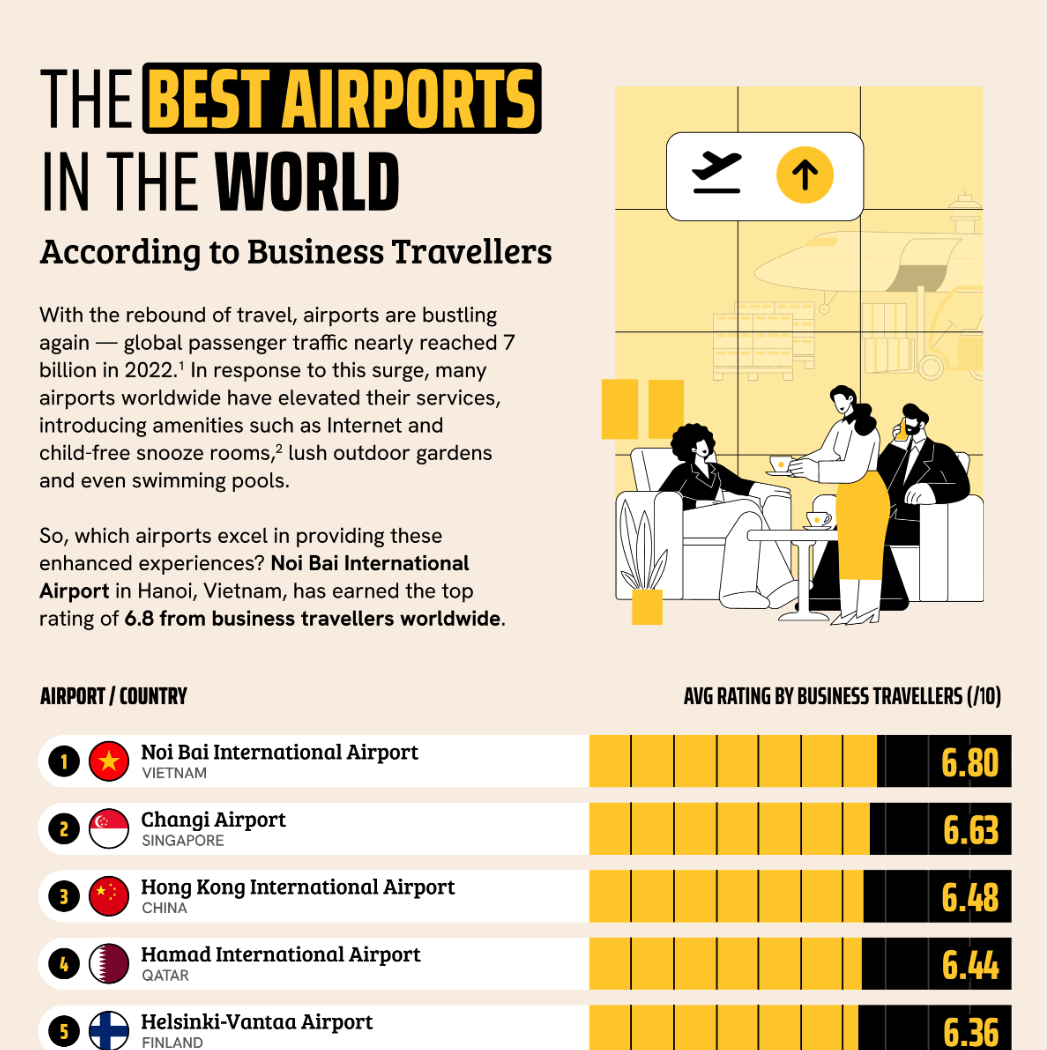
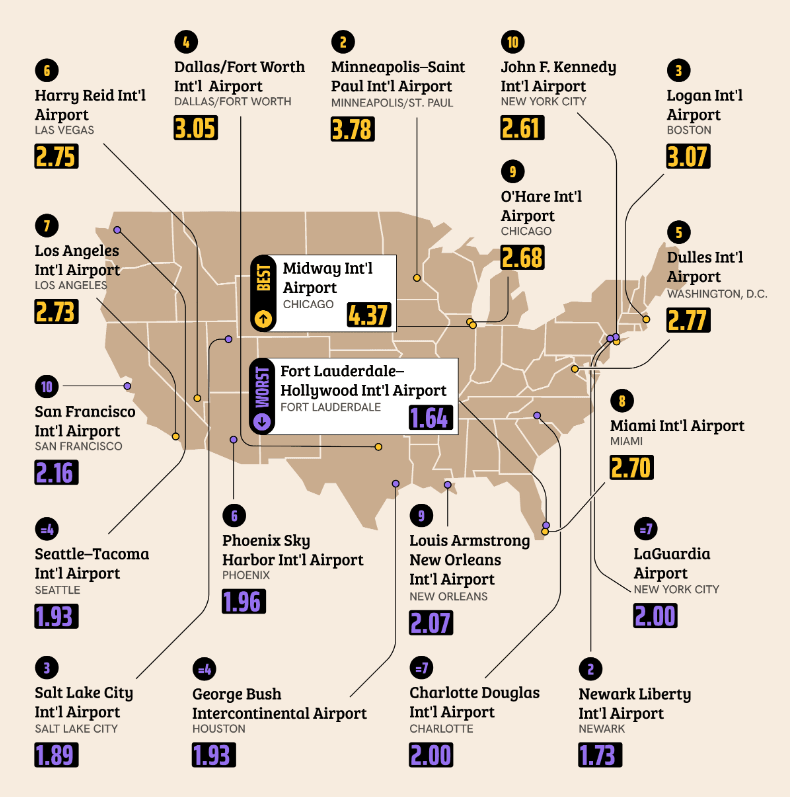
Other content creators like to split them up into separate shareables. For instance, BusinessFinancing.uk’s Best and Worst Airports in the World has a list:
And then, later in the post, a map:
It comes down to your budget and design capabilities. But some shareable is recommended.
Expect to spend anywhere from $500-$1000 for a good designer to create any of the above static graphics.
5. Building a Target List
Now that you have your article written, or at least outlined with your specific cities or regions, it’s time to start building your target list.
You can divide the types of publications you want to target into several categories: industry publications, local/regional publications, and topic-relevant blogs.
Industry Publications
In addition to pitching the cities featured in your article, you want to pitch those interested in that topic—in this case, art.
For your “Most Artistic Cities in America,” consider art industry publications that might be interested in this story.
A quick way to find these publications without a subscription to an expansive database is to search Google News.
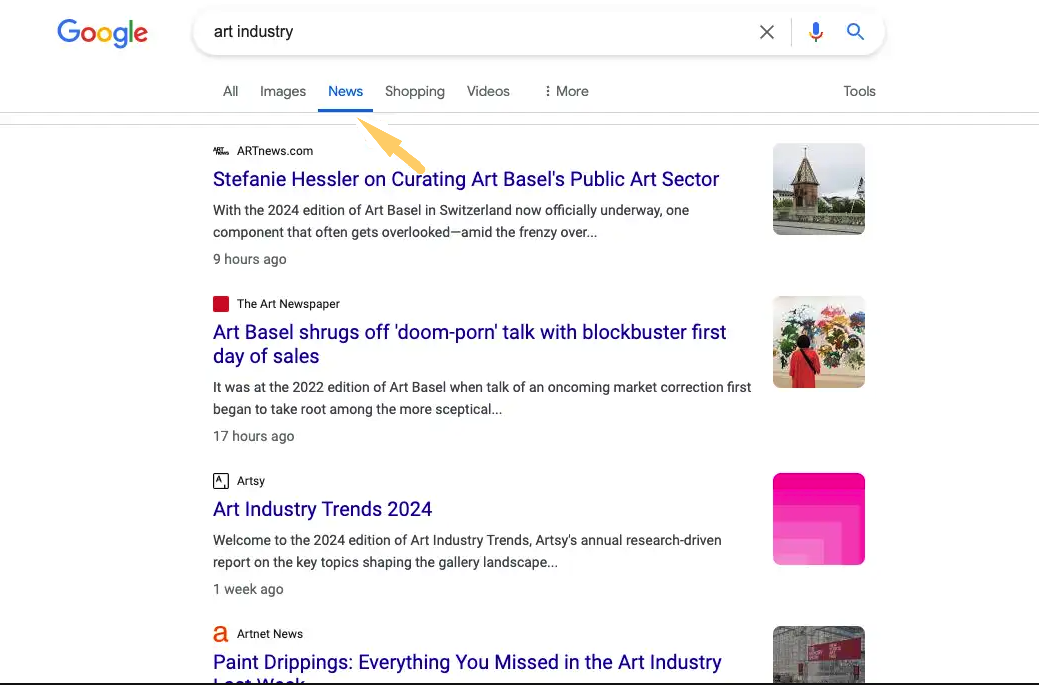
For example, you can search “art industry” and filter to “News” up top, and this will take you right to the types of publications that cover topics like this in that industry.
Find Subsections
You can even get more niche in different subsections of art, such as painting publications, music publications, photography publications, etc.
Search terms like “photography publications,” “painting profession,” “music industry,” and more.
This will help you get a much more focused, niche list who is likely to be interested in the top city for music, photography, and so on.
Local/Regional Publications
Next, build a list of local and regional publications in the areas you have included in your article.
Within these publications, search for similar stories they have published before about their city being named a top or worst city.
Also, search for specific topics in those cities; for example, if your article is about the best places to start a business, target local business reporters.
Suppose you have access to a media database.
In that case, you likely can add multiple layers of filters, like topics, “art,” and “local news,” as well as geography, like “Tennessee,” or even more specific, “Memphis.”
You can still do these types of searches without a paid media-based subscription through free search engines and social media.
For the search engines, start by searching “Memphis local news,” and work your way down from there.
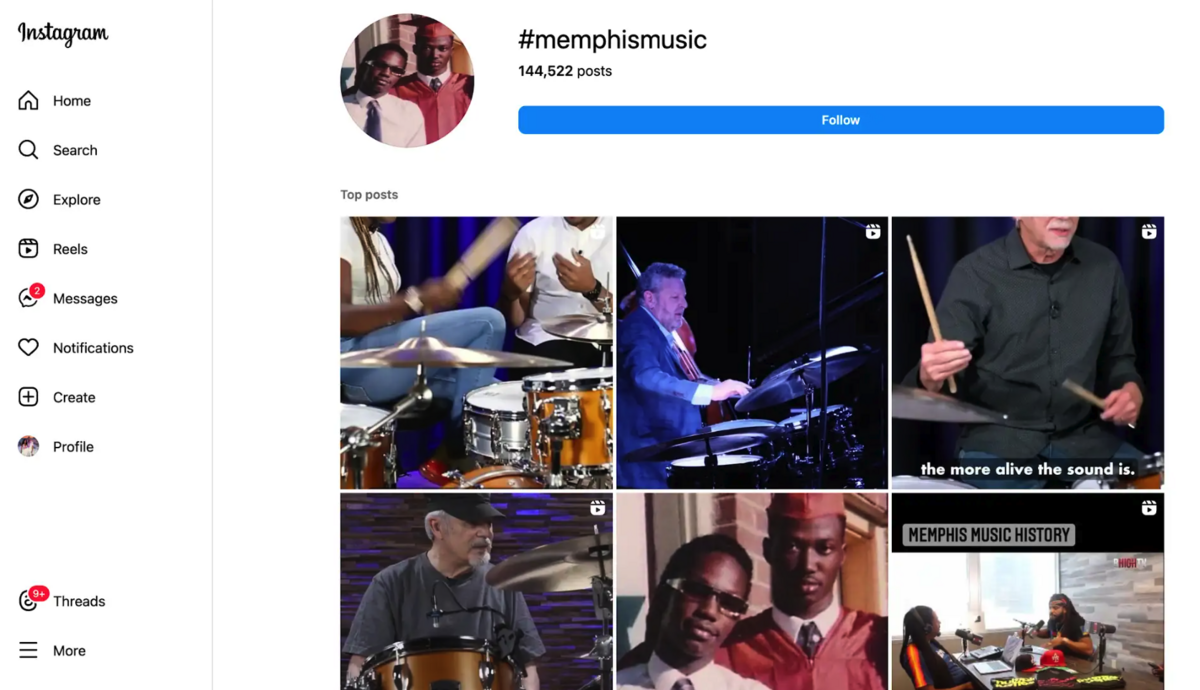
Conduct similar searches on social media platforms like X, Instagram, TikTok, and LinkedIn.
Even better, use hashtags. Not only will these types of searches help you find publications, but they will also likely show you who specifically to pitch.
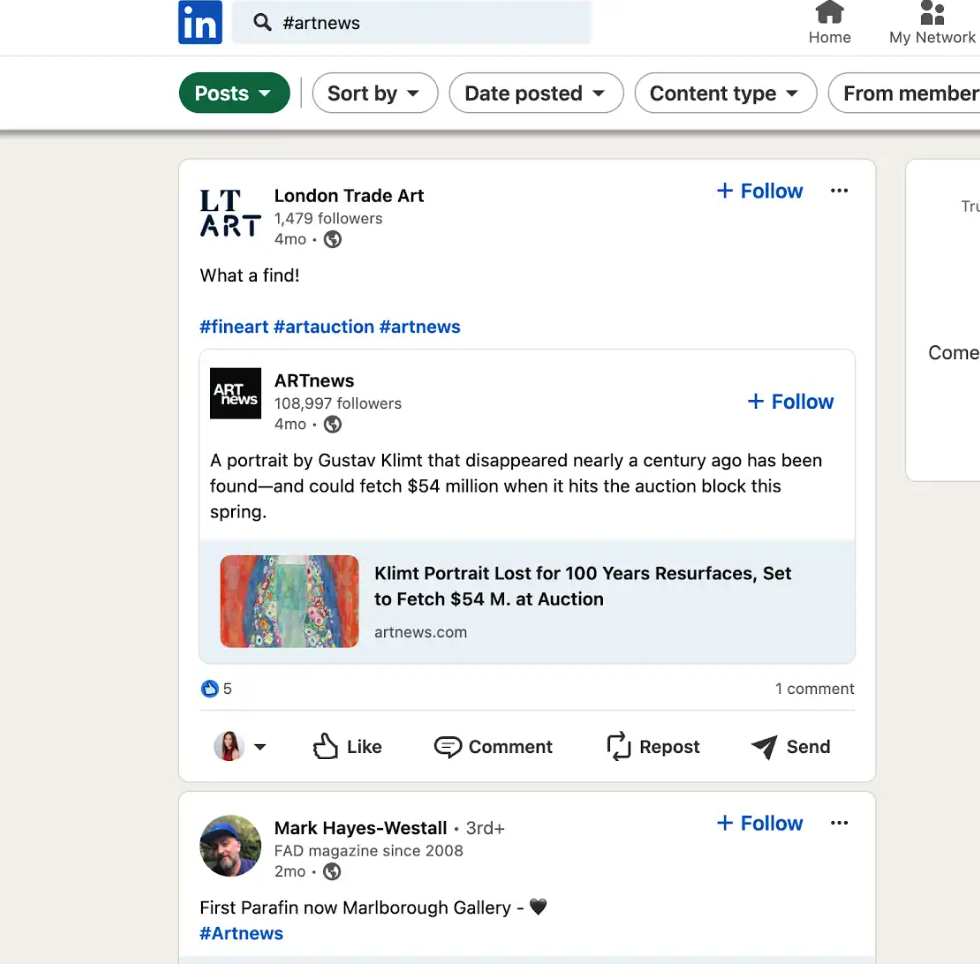
For example, you can search #memphisnews or #memphisart, #memphismusic, etc.
Topic-Relevant Publications
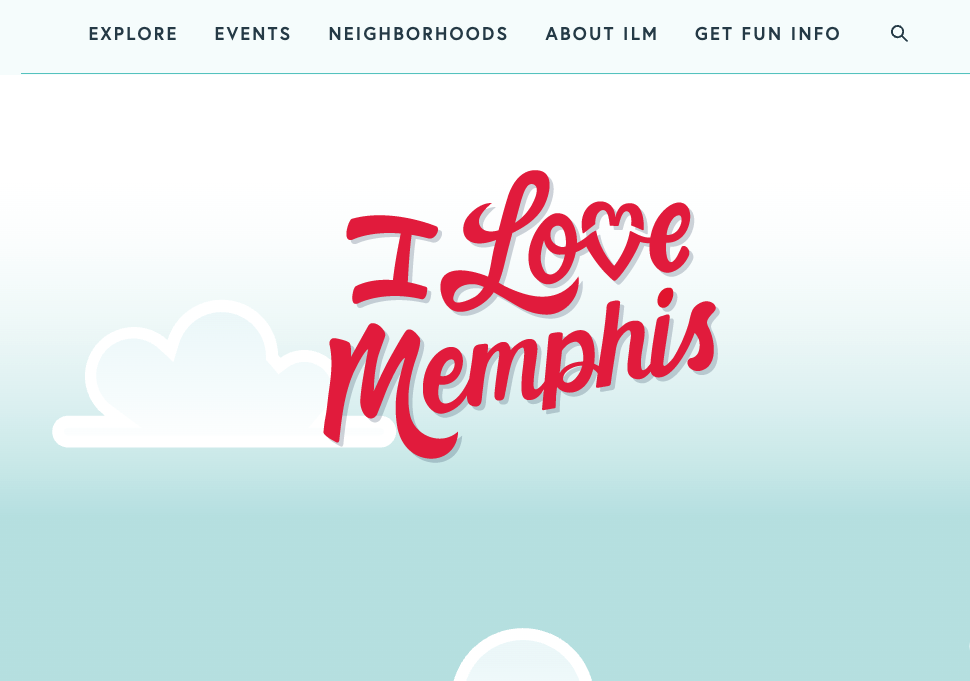
Finally, don’t discount coverage from relevant blogs. Look at bloggers who cover all topics in their specific cities or blogs who target the particular industry you have written about.
These can all be legitimate prospects.
For example, the I Love Memphis blog covers various topics around Memphis, and even has a dedicated “Art” section, while Design your Trust focuses completely on art.
Building Lists with BuzzStream
A great way to start building your target list is to use the Buzzstream Research List tool, which can save you a lot of time.
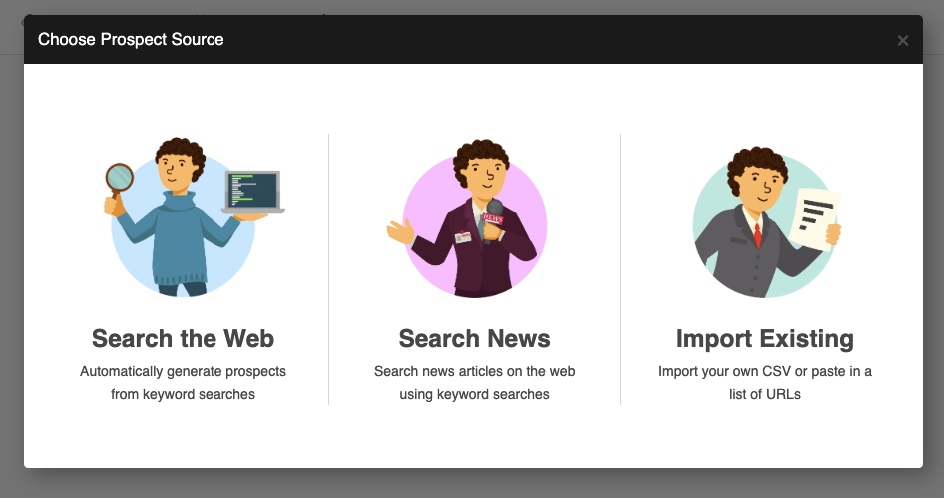
It combines several searches simultaneously from Google, Google News, or imported lists.
I like to create projects for each of my angles and build lists based on those angles.
For instance, if I wanted to build a list of local/regional pubs in Memphis, I’d combine all the search queries simultaneously.
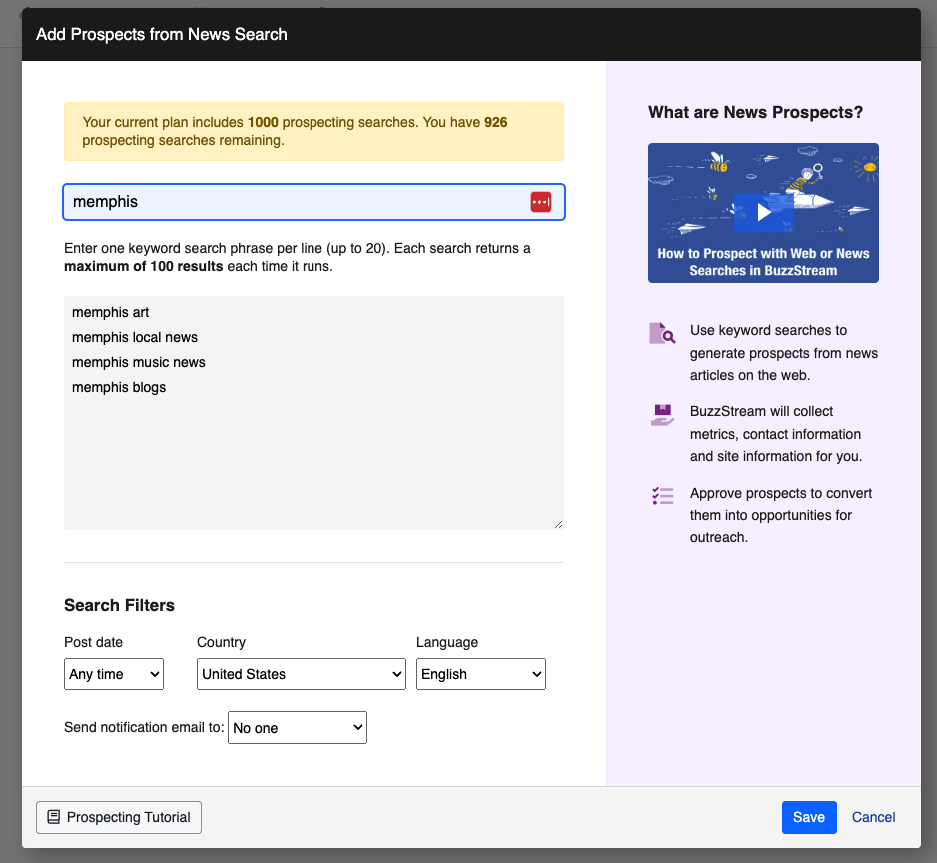
Then BuzzStream compiles them into a list, allowing me to review the sites one by one.
4. Writing Pitches
Pitching the media is an art. No single templated pitch will capture every journalist’s attention, so it is essential to take your time to make your pitches custom to each target or at least to each segment of targets.
Perfecting your subject line and the email body is critical.
Subject Line
This is your [very short] opportunity to grab the reporter’s attention! Keep in mind subject lines get cut off, so try to keep it to 6-10 words or 40-60 characters.
Instead of “The Memphis art scene was featured in a recent Expedia article on Most Artistic Cities,” keep it short and catch their eye early on; “Expedia names Memphis a top art destination.”
Email Body
Every reporter is on the top of their game when it comes to spotting mass pitches blindly sent to hundreds of journalists – and they will quickly be sent to the trash folder.
For example, instead of saying, “I’ve read some of your recent articles, and I think you would be interested in this story,” try, “I read your recent article on the Memphis art scene and love how you point out the growing numbers of galleries in the area.”
Personalization
When building your target list, more than likely, each reporter on your list has written an article relevant to what you are pitching, which is why they ended up on their list.
Make your pitch stand out by referencing this article and showing them you read it.
Pay them a compliment—it can go a long way! Try pointing out a particular statement they made in the article and elaborate on why you agree.
For those on your list for other reasons, give them a reason they should care about what you are pitching.
What’s In It For Me?
Journalists’ main goal is to give their audience something they are interested in, so tell them why this topic would resonate with them.
To put this all together, below is an excellent example of a pitch to a local Memphis news publication about Memphis being featured in a story about the most artistic cities in America:
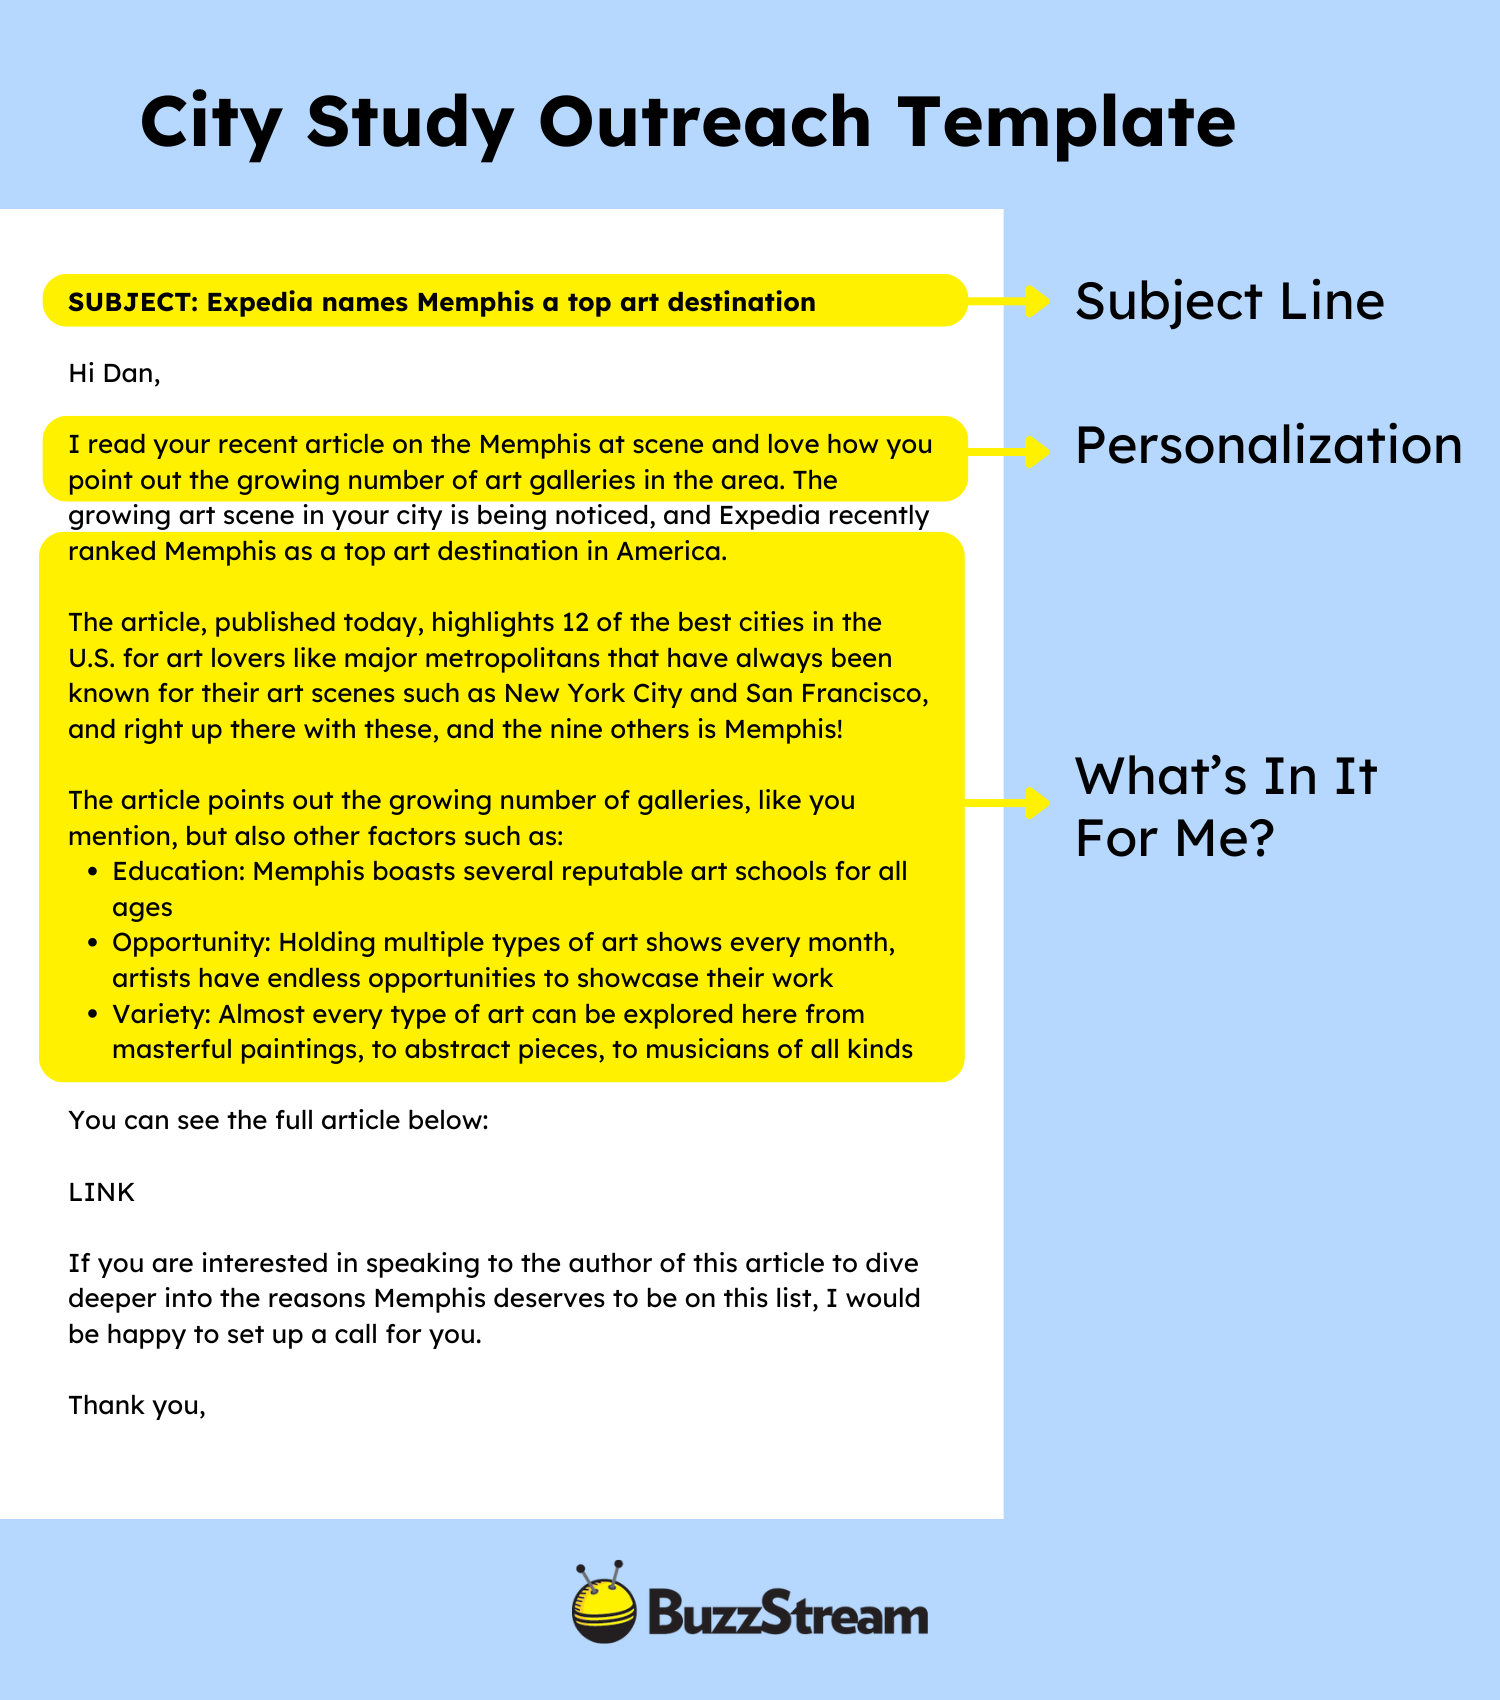
An email template for this may look something like this:
Hi [First Name],
I read your recent [Research Page Title] on [Website Name], and I thought you might be interested to know that Memphis was named the most artistic city in America.
The full report can be found here [link to report/press release].
[Name], [Title] at [Company], [short bio to validate their expertise on the subject]. [He/she] is available to elaborate further on the findings in this report. If you would be interested in speaking with [Him/Her], I would be happy to set up a call.
If time does not permit a call, I am also happy to answer specific questions you may have on the subject or provide a quote.
I look forward to hearing from you soon.
And remember, pitching and having something land takes time. Sure, you can get lucky and breakthrough with a journalist on your first pitch, but more often than not, your name and/or your brand’s name need to catch their eye multiple times before something sticks.
You might need to pitch people multiple times before it catches their eye. Or they may have opened the first email, got sidetracked, and forgot to return.
Follow-up emails can take time, so tools like BuzzStream have sequencing tools to save time.
You can set follow-up emails to get sent after a set time if there has been no response.
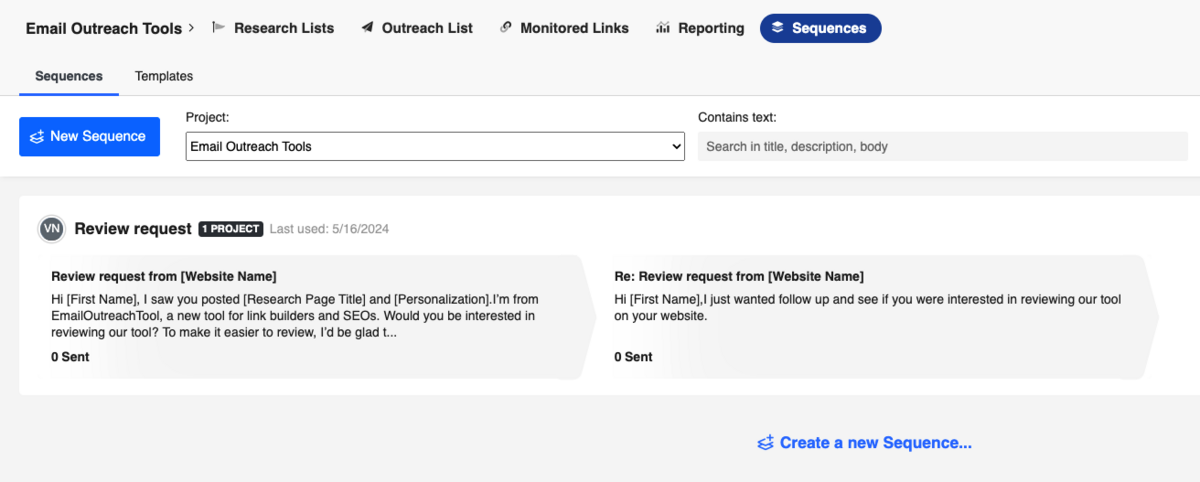
You can still use sequence templates and add customization by leaving placeholders where you want to customize each pitch, then do so while pitching the emails individually.
5. Tracking and Analyzing
So, you’ve sent your pitches, all of the hard work is done, right?
Not quite.
Once your pitches have gone out, it is just as important to start tracking for coverage and using these results to analyze the campaign.
Not every journalist who covers a topic that was pitched to them will actually let the source know, so it is important to check for coverage regularly.
You can do this through manual web searches, or by using various tools.
We cover how to find media mentions and links in full so I won’t go over everything here.
Remember to ensure you cover your bases – not every tool catches everything!
Here are some of the high-level tips and tricks:
Manual Searches
Although you may have a preferred search engine, such as Google, Bing, Yahoo!, etc., it is good practice to scan each to ensure you don’t miss anything.
You can start by searching the email subject of your pitch, for example, “Memphis named most artistic city.” You can also get creative by using search booleans like “‘Memphis’ AND “Expedia’ AND “art’.
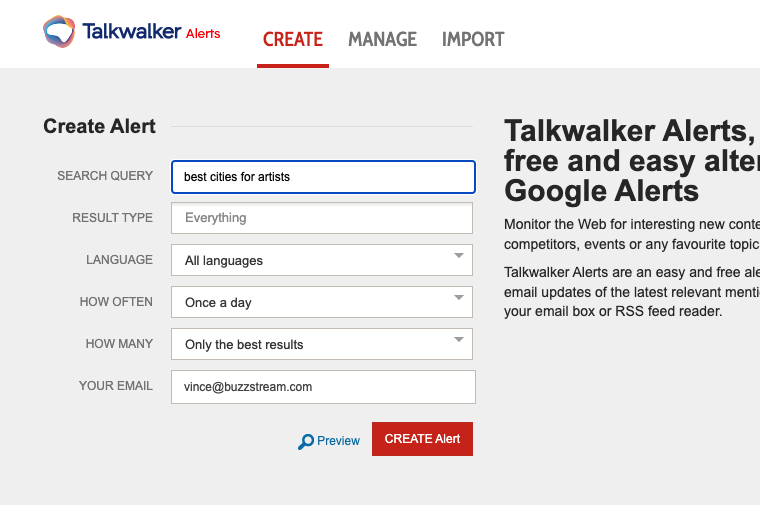
You can also set up Google Alerts for the searches showing you the most relevant results to save you time from repeating the same task everyday.
Tools
Additionally, you can use various tools to help locate and track backlinks to your campaign.
Tools like Google Alerts or Talkwalker can alert you of specific mentions of your campaign. Simply start a free account, then enter the search query that you’d like Talkwalker to find.
In our case, we’d set up a few, starting with something broad like “best cities for artists” and then get more specific for alerts for Memphis, etc.
Some More City Study Examples
Now that we have gone through the steps to create a winning strategy for city study articles, let’s examine other successful examples.
Our digital PR examples collection found that this could be applied to states, countries, and even worldwide.
Here is a mix of examples:
Fun and Engaging State Study: Preply
Preply is a peer-to-peer language tutoring site, so their blog and messaging centers around communication.
They decided to take a fun, attention-grabbing approach with their Most Apologetic States campaign.
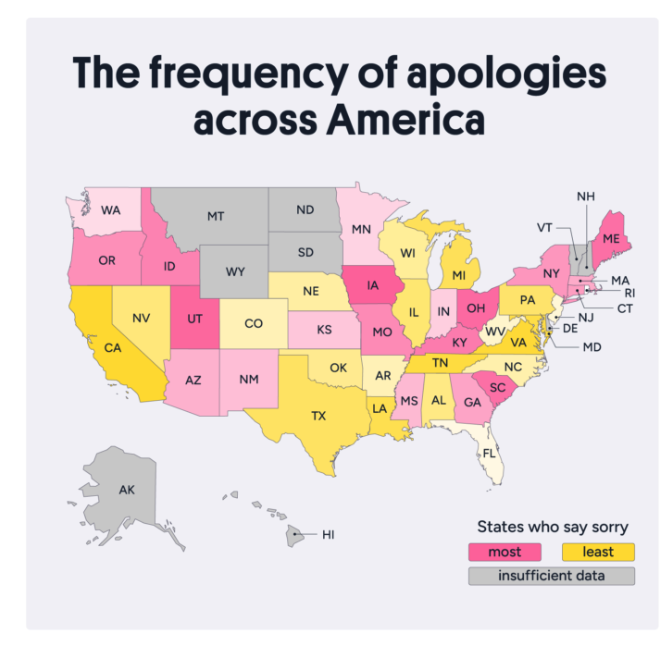
They then pitched this to publications in the top-ranking states.
They ended up with over 100 LRD from top publications in the US, like the Inquirer and Cleveland.
High-level Generic and Factual Study: Booking.com
Booking.com, a popular online travel booking engine used proprietary data from a survey they conducted to create this engaging list of the world’s most welcoming cities.
They used this city study to include a corresponding guide on what to do in each city, which led to many of their booking pages.
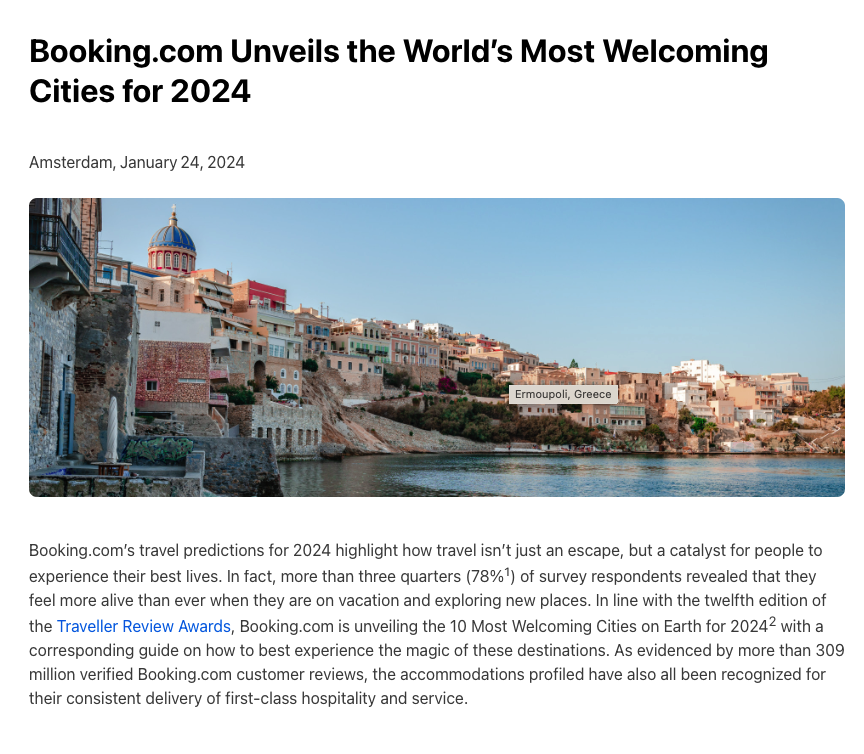
Although the linked piece only has 17 LRD, Booking.com gets many links directly to its homepage from such campaigns.
If you use a tool like Ahrefs’ to check for backlinks to their homepage, you can search for anchor text and surrounding words that include the piece’s title.
For instance, you can see that Travel and Leisure linked to the homepage when mentioning the Most Welcoming Cities on Earth campaign:

This is not an uncommon way to generate links to a homepage, as evidenced by our digital PR and SEO analysis.
Visually Pleasing Study: BusinessFinancing.co.uk
Businessfinancing.co.uk is a publishing site that provides research and resources for small businesses in the UK.
Providing good data is one thing, but adding a unique and easy-to-follow infographic is a great way to make your listicle stand out even more, and they did a great job at this in its overview of the best and worst airports in the world.
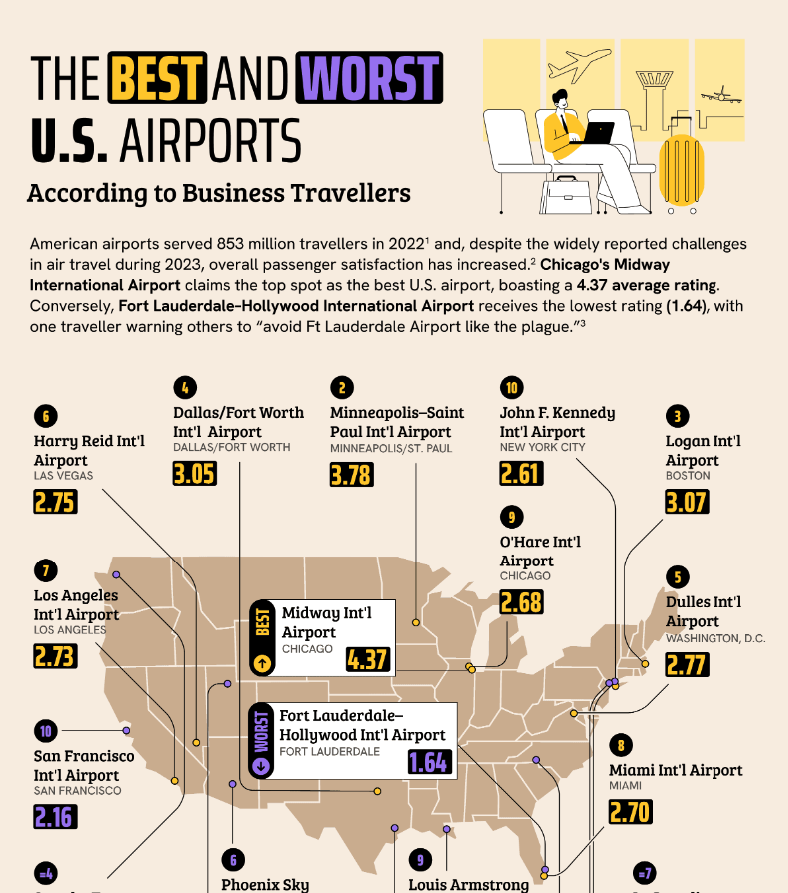
The results were over 75 LRDs from high-authority news publications in different countries.
Maximizing the SEO and Brand Awareness Impact of City Studies
As the examples above show, city studies serve a multifaceted purpose in the digital content landscape.
These articles can significantly boost a website’s visibility and credibility by increasing domain authority, expanding brand awareness, and improving SEO rankings.
Each step, from ideation and research to pitching and tracking results, is crucial for crafting a successful city listicle.
By leveraging high-quality data, targeting the right publications, and delivering engaging content, you can ensure that your listicles resonate with audiences and achieve your strategic goals.
Whether through fun, factual, visually appealing, or interactive approaches, city listicles remain a powerful tool in the content creator’s arsenal, driving traffic and fostering engagement across various platforms.
Jodie Booras
As a seasoned and passionate public relations professional, Jodie Booras founded Kaiona Communications in 2023 to pursue freelance public relations, social media, and content opportunities with clients and agencies in various industries. With a background deeply rooted in strategic communication, Jodie brings a wealth of experience to the table, having honed her skills over the years across various industries.Disclaimer: The author's views are entirely their own, and don't necessarily reflect the opinions of BuzzStream.
 Check out the BuzzStream Podcast